FP&A selects and monitors KPI and takes action to ensure performance targets are achieved
KPI: Monthly Customer Volume - Achieve budgeted customer volumes
How is each customer progressing towards the monthly budgeted volumes? Let’s track this weekly.
Given the progress month to date, using the projected volume, we can quickly see which customers are projected to miss their budget.
Features of this chart: Fully automated the underlying volume projections and ranking and display of unfavorable variances in red.
Action: FP&A performs a deeper dive into the drivers of the projected miss and then works collaboratively with the Sales teams assigned to Customers 2, 5, 3 to develop and deploy counter measures.
Result: Sales team is able to work with Customers to accelerate volume through the rest of the month and meet and exceed budgeted volumes.
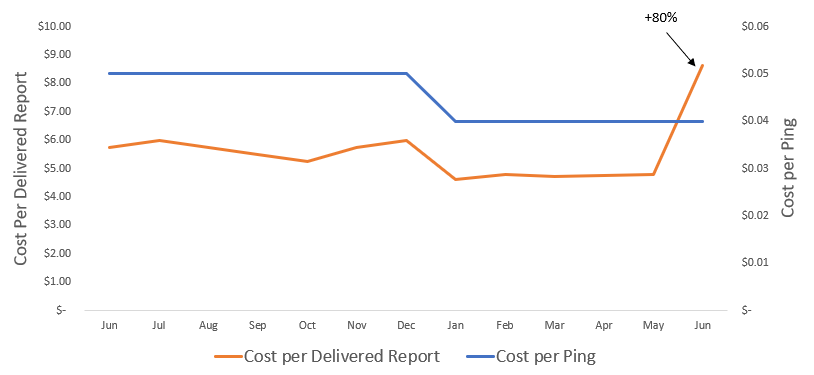
KPI: Monthly Cost Per Delivered Report - Focus on the correct KPI to lock in profitability
After having renegotiated lower cost per ping effective Jan, the team feels good about seeing the cost reduction.
However, the cost per delivered report increases by 80% in a month!
Action: FP&A performs a deeper dive and discovers that there was a slight Product Engineering change and the quantity of pings (per delivered report) increased dramatically.
Result: The Product Engineering team was alerted and the change was quickly reversed so that the negotiated cost reduction would improve profitability as expected. This provided the Product Engineering team with better visibility and understanding of the financial implications of their product updates. Agreed to review future product changes before being put into production to ensure no negative financial impacts.
KPI: Annual Customer Project Revenue - Deliver Revenue budget by countering customer onboarding schedule variance
The customer onboarding schedule update shows the revenue forecast is at risk.
Features of this forecast model: Fully automated the forecast model, including the start month and calculating the first and last partial month amounts using just the 4 project inputs in blue/yellow.
Action: FP&A’s model identifies the causes of the projected miss of $197k (3.1 months pushout of Customer3 and 4 projects) and initiates discussions with the Sales team to mitigate the miss.
Result: The Sales team was alerted to the projected miss and were able to make adjustments to the schedule, guided by FP&A’s financial expertise, would fully recover the projected miss and surpass budget.


